Drive north from the tourist core of Clifton Hill toward the rural concessions of Niagara-on-the-Lake and you cross a hidden boundary: the compact Queenston Shale gives way to thicker overburden and occasional karstic voids in the Lockport Dolomite. That transition matters when you are siting a deep foundation or mapping the extent of solution channels beneath a proposed warehouse slab. The subsurface around Niagara Falls Ontario rarely reads like a textbook, and that is precisely why test pits alone can miss the lateral discontinuities that seismic tomography picks up. We run both P-wave refraction and high-resolution reflection lines to deliver a continuous image of bedrock topography, fracture zones, and velocity contrasts that standard drilling programs overlook. In a city where the Niagara Escarpment defines everything from drainage to seismicity under the NBCC 2020, having a tomographic cross-section means you are not guessing about what lies between boreholes.
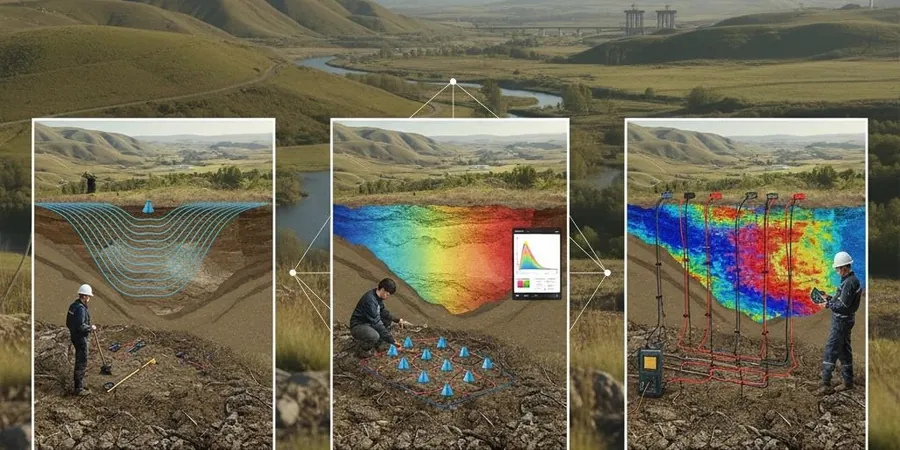
A tomographic cross-section reveals what lies between the boreholes—velocity inversions, karst voids, and fracture corridors that govern foundation risk along the Niagara Escarpment.
Methodology and scope
Local considerations
Niagara Falls Ontario grew in bursts—first around the mills fed by the hydraulic canal, then outward along the escarpment brow, and later into the flat farmland of the former Lake Iroquois plain. Each expansion left behind fill of wildly different origin: quarried limestone rubble near the old power stations, lacustrine silts south of the QEW, and undocumented backfill in the tourist precincts that were ravines a century ago. Seismic tomography cuts through that palimpsest by mapping the velocity contrast between fill and native material, flagging zones where compaction is insufficient or where buried infrastructure voids still exist. In a regulatory environment where the Ontario Building Code defers to NBCC for seismic site classification, missing a low-velocity pocket or an unmapped karst conduit can shift the design spectrum enough to trigger costly foundation redesign, so the tomographic survey becomes a kind of insurance policy against the surprises that historical land use leaves behind.
Applicable standards
ASTM D5777-18 (Standard Guide for Selecting Seismic Refraction Methods), ASTM D7128-18 (Standard Guide for Selecting Seismic Reflection Methods), NBCC 2020, Division B, Part 4 (Seismic Design, Site Classification via Vs30)
Associated technical services
P-Wave Seismic Refraction Tomography
Multi-shot refraction surveys processed through iterative inversion to produce continuous 2D velocity models along proposed foundation alignments. We configure array geometry to image the overburden-bedrock interface, detect low-velocity zones (karst, fractures, decompressed rock), and extract Vs30 for NBCC site classification. Typical line lengths range from 69 to 138 metres with geophone spacing adjusted to target resolution.
High-Resolution Seismic Reflection Profiling
Common-midpoint (CMP) reflection acquisition designed for deeper targets—buried valleys, fault offsets, and the base of weathered rock—where refraction methods lose resolution. We process shot gathers through statics corrections, velocity analysis, and post-stack migration to produce interpretable time sections that complement borehole logs and resistivity data.
Typical parameters
Frequently asked questions
How much does a seismic tomography survey cost in the Niagara Falls area?
For a typical refraction line of 115 metres with a sledgehammer source, budgets generally land between CA$3,380 and CA$5,200 depending on access conditions and the number of shots per spread. Reflection surveys requiring an accelerated weight drop and longer offsets run higher, typically CA$5,700 to CA$7,570. Every quote includes mobilization within the Niagara Peninsula, processing, and a signed report with velocity sections ready for your geotechnical engineer.
Can seismic tomography detect karst cavities beneath the Lockport Dolomite?
Yes, with the right acquisition parameters. Air-filled cavities produce a strong velocity drop that tomographic inversion can resolve if the cavity diameter is at least one-fifth of its depth. Water-filled conduits are subtler but still appear as low-velocity anomalies. Where the interpretation is ambiguous—air versus water fill—we recommend pairing the seismic line with an electrical resistivity profile to differentiate the two conditions.
How long does a seismic refraction or reflection survey take on site?
A single 115-metre refraction line with a two-person crew typically takes half a day, including layout, shooting, and breakdown. Reflection surveys with CMP fold require more shot points and a larger spread, so plan for a full day per line. Processing and interpretation add another three to five business days before the draft report is ready.